When ever I create a Dynamo graph, what I do at the end is reviewing the graph (or python code) and ask myself whether it is the fastest flow. (Yes, I'm a Korean. Click if you want to learn a Korean word pali-pali)
There would be a lot of situations though, there are some representative ways to speedup Dynamo.
1. Use Numbers rather than Geometries as possible.
 |
| figure#1. Geometry.Translate |
 |
| figure#2. Point.ByCoordinates |
3. Use Python.
One known good reason to use python in Dynamo is to import Revit API, but it is not the only advantage.
1st. Minimize data sets to save.
2nd. Make a Dynamo graph smaller.
3rd. Easy to combine multiple calculations.
4th. Enable to skip unnecessary calculations.
and more...
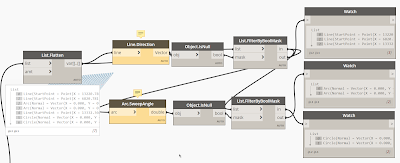
Below is an example of using python. One simple Python Script replaced multiple nodes. Python made the graph smaller and speedup the flow.
 |
| figure#3. Categorizing curves using original nodes |
 |
| figure#4. Categorizing curves using python |
 |
| firuge#4-1 Python code for Categorizing curves |
This comment has been removed by the author.
ReplyDelete